Sunday, December 18, 2016

The SDA's Financial Warchest

Over the last two financial years the central office of the Shop Distributive and Allied Employees Association (SDA) made over 4.3 million dollars in profit. This is at a time when most unions have been losing money as they struggle with declining membership. Flipping through the asset listing on the SDA’s balance sheet, it’s hard to remember that this is a union for some of the lowest paid workers in the country, and not some large private hedge fund.

The SDA has always been a bit unique. Despite representing a largely young and mostly female workforce of checkout and retail workers, the union has been vocal within the Australian Labor Party campaigning on a conservative Christian platform against abortion and gay marriage. One of the original anti-communist unions in Australia, the SDA is also known for taking a non-combative negotiating approach when talking to businesses, winning the dubious honour of being the only union that has been praised by Eric Abetz.

More recently, the SDA has come under criticism for deals struck with major employers that appeared to be too soft on the companies involved, with workers losing penalty rates and overtime in exchange for minimal increases in their hourly pay. Fair Work Australia found that workers with more weekend and night shifts were actually worse off under these deals. Considering the whole purpose of a union is to gain better working conditions for its workers, this finding raised serious questions about the credibility of the SDA.

Despite the controversy the SDA has attracted over the last six months, it doesn’t seem to have effected their bottom line. The 4.3-million-dollar central office profit from the last 48 months came off revenue of just 18.3 million, giving the central office a profit ratio of over 22%. Most companies would kill for margins like that. To put these figures in perspective, the Construction Forestry Mining and Energy Union (CFMEU) central office posted a loss of $433,256 over the last two reported years, the Australian Workers Union (AWU) central office lost 1.36 million and even the Australian Nursing and Midwifery Foundation (ANMF), one of the only unions increasing in members made a small loss.

For a Not-for-Profit organization to be making profits like this is pretty strange. The basic long term financial principal for this type of organization is to break even, while ensuring you have enough money in the bank for a rainy day. While you want to save some money, overall your revenue should be close to matching your expenses to ensure you are doing as much as you can while at the same time not charging members more fees than you need to. The SDA central office doesn’t seem be run per these principles. In February 2015, the same financial year the national organization made a profit of over 4 million the SDA released a press release stating that they needed to increase their membership fees as their costs had gone up. You do have to wonder how those same members would have felt a couple of months later if they looked at the annual report of the national office. It’s not as if these profits were a one off either. The central office has built up an impressive amount of equity on its balance sheet; 26.7 million in term deposits, an 18.5 million-dollar portfolio of investment property, far more than any other union I could find. 
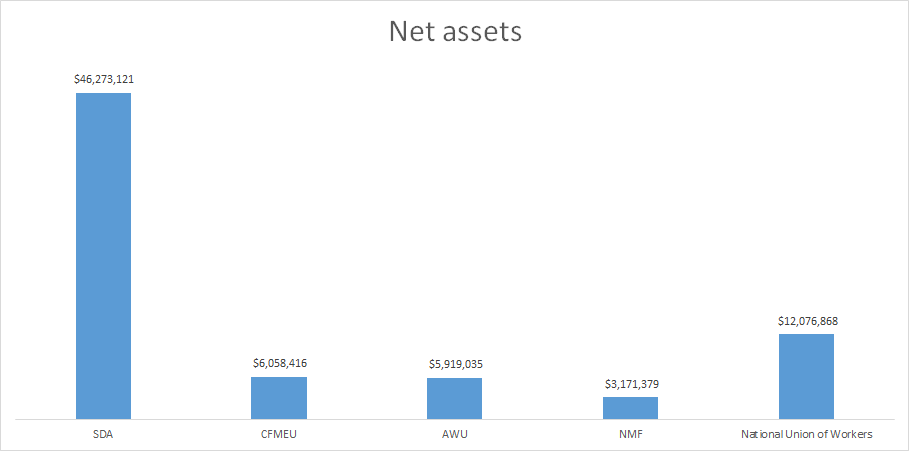
The below graph compares the net balance sheet position of some of the national offices of the major unions in Australia. As you can see, the SDA easily has more money than these four other unions combined.

In addition to the money held by the central office, the SDA has significant funds held by their state branches and other offices. The Victorian branch for example made its own profits of 1.56 and 2.37 million in financial years 2015 and 2014 respectively, and has over 30 million dollars in net assets. For NSW it’s harder to find up to date numbers as most financial activity is funnelled through the interestingly named SDA NSW Deductions Account Office, a separate entity that does not seem to have to report its financial statements under the Fair Work act. Accounts lodged as evidence during the Royal Commission into unions show the Deductions Account Office had 40 million dollars in net assets in 2013, and this amount could well have grown substantially since then, with the organization reporting a cash surplus of 2.7 million during the 2015 financial year under disclosure laws for politically related entities. When you add up the wealth of the various separate entities of the SDA, there is easily more than 100 million dollars that has been saved by the organisation.

The idea that the SDA has built this level of wealth while putting together soft wages deals with the likes of Coles, Woolworths and Hungry Jacks is distasteful. To put it another way, it means that a substantial portion of these same members’ union fees were going to buying term deposits for the SDA as opposed to genuine union expenses. Could the SDA have negotiated better deals if they had spent more money by employing more people? Would more representatives on the ground have allowed them to realize that their deals were disadvantageous to some workers before Fair Work Australia pointed it out to them? These are hypothetical questions, but reasonable given the events of the last six months. The SDA might argue that by building up profits they are ensuring the long-term life of the union, but most people joining a union would reasonably believe that their fees are going towards the running of the organisation, and not whatever empire building plan the union has in mind.

A couple of weeks ago, a rival to the SDA was announced, the Retail and Fast Food Workers Union. Explicit in their criticism of some of the SDA’s past practices, they are positioning themselves as a more progressive and combative alternative.  One of the main things they are campaigning on is the reinstatement of penalty rates for those workers that do not have them under SDA deals. While the SDA may not be particularly popular, trying to build a union at a time like this will be a difficult task. Union membership nationally has been declining, and the SDA are well entrenched at many large employers. You would imagine the new union will need a significant membership base before any of the larger companies agree to even talk to them. Whatever the SDA’s reasoning for building up their balance sheet to where it is now, one thing is clear: They have a significant war chest to see off this latest challenge.

Tuesday, December 8, 2015

Fortescue Metals and the politics of debt

This piece first appeared on New Matilda's website:


Last week, with little fanfare or fuss, Fortescue Metals did something that the Greek Government has been trying and failing to do for over seven years. 

Purely due to concerns about their ability to repay their massive debt obligations, they were able to get their creditors to write off $122 million dollars in debt. This was done without any special appeals, government intervention or political pressure.

There are more similarities between Fortescue Metals and the Greek Government than you might think. Much like the Greek Government, Fortescue metals could be accused of being a little too free with cash in times of plenty. From 2009 to 2013, with the mining industry booming, Fortescue Metals increased their debt by an astonishing 280 per cent, piling on $9.93 billion of debt in the process. With Iron ore prices high, finding borrowers was easy and Fortescue’s share price soared accordingly.

Again, much like the Greek government, the crash came quickly. In late 2013/early 2014 as the Chinese economy slowed, iron ore prices began to drop. As prices fell, so did Fortescue’s share price. The graph below charts the percentage changes in the price of iron ore and Fortescue metals shares over the last five and a half years.


Fortescue-debt
As the situation continued to worsen, attention soon turned to Fortescue’s debt. Analysts realized that Fortescue was going to struggle to break even with Iron ore prices where they were, much less meet the massive debt repayments that they had committed to in the next few years.

As a result of this concern, the corporate bonds that Fortescue had sold in those boom years began to trade at considerable discounts. A bond is basically a promise that a company will pay the owner a set amount of money on a certain date. With Iron ore prices where they were, the concern was that by the time Fortescue’s bonds matured the company would be bankrupt, leaving bond holders with essentially worthless pieces of paper. Unsurprisingly no-one fancied being left in this situation, and Fortescue bonds started to trade as low as 75 cents in the dollar.

This is where the story gets interesting. On the 11th of November 2015, Fortescue announced that they intended to buy back $750 million worth of their own bonds that were maturing in 2019 and 2022. As these bonds were trading at a significant discount, Fortescue would effectively be cancelling portions of its own debt. Creditors lined up at this chance to cut their losses. By last Monday the deal was complete. Fortescue has managed to buy $750 million worth of bonds for only $618 million dollars, effectively making a saving of 122 million dollars.

Without any special appeals and minimal fuss, Fortescue had managed to convince their creditors to reduce their debt purely because they were less likely to pay it back.
Needless to say, Fortescue’s creditors did not agree to this deal out of concern for the company. There were no impassioned speeches about the need for debt relief by Fortescue’s CEO or demonstrations by Fortescue shareholders outside major banks. Instead, this was a cold-blooded commercial decision. Fortescue’s creditors decided that given Fortescues financial position they would rather take $618 million now, rather than the promise of $750 million plus interest in 4 or 6 years’ time.

The contrast with Greece couldn’t be starker. Since the Greek debt crisis broke in 2008, throughout the numerous bailout agreements, Greece has never been able to get a cent taken off its massive debt obligations. This is despite Greece reaching much more perilous financial positions than Fortescue on numerous occasions. Every new financial bailout has simply included the loaning of more money to Greece, further increasing the amount that the Greeks will one day have to pay back. Throughout these bailouts, the IMF has given repeated warnings current debt levels are simply unsustainable and that Greece will be unable to repay its debt without some form of reductions. However, Germany has continued its steadfast refusal to even consider debt reductions even when Greece has been on the brink of bankruptcy, a situation where Germany would have ended up losing nearly all of the money that it was owed.

From a purely financial perspective Germany’s behaviour over the last five years makes little sense. As the Fortescue creditors understood, sometimes it is better to cut your losses than be left with a massive loan to an entity going bankrupt. The problem is, as numerous commentators have pointed out, Germany is not motivated purely by economic concerns in this situation. The idea of a write down in Greek debt is immensely unpopular in Germany, meaning it would be political suicide for any politician to agree to it.

Furthermore, if Greece manages to get a reduction in its debt, there is the concern that other heavily indebted countries like Spain and Italy would soon be lining up expecting the same thing (funnily enough, no-one worried that GlenCore and Rio Tinto might get the wrong idea when selling Fortescue’s bonds back to them at a discount). Germany seems prepared to let Greece go bankrupt, at significant financial cost, rather than even consider small reductions in Greece’s debt.

There is a strange idea of morality around inter-country debt which is not raised in the corporate setting. This allows companies to be much more flexible with debt and explore a wider range of options than are available to sovereign countries. This advantage extends over individuals as well. One can imagine the response that you might get if you tried the Fortescue equivalent with your own personal loan. Although banks happily sell your debt at cents in the dollar to debt collectors, I sincerely doubt they would ever respond well to a suggestion like this: “Look Mr Bank Manager, I know I still owe $15,000 on this car loan of mine, but since last year I’ve actually lost my job and picked up a drug addiction so to be honest you’ve really got Buckley’s of me ever paying you back. How about I just give you this $10,000 I got from selling the car and we call it even?” You would be laughed out of the building.

The future for both Fortescue metals and Greece remains precarious. For Fortescue, if Iron Ore prices fall further there is still a large chance the company will go bankrupt, while a number of economic commentators much smarter than me remain concerned that Greece will be unable to meet its repayment obligations under the most recent bailout deal. However, despite a potential Greek default having a much larger negative social effect, it seems clear that Fortescue will continue to enjoy a wider range of options in dealing with its debt than will ever be available to Greece.

Monday, November 23, 2015

Why you shouldn’t buy a house in your 20s.

I’m getting to the age now where everyone seems to think I should buy a house. Once you reach 25, conventional wisdom seems to dictate, if you’re not spending all your spare time saving for a deposit, watching bad home makeover shows and visiting auctions every Saturday you aren’t a real adult. Our obsession with the idea is so strong that when Joe Hockey suggested that to buy a house you needed a good job that pays good money (hardly a controversial statement when you consider that most first home buyers are now looking at properties worth more than half a million dollars) he was met with howls of outrage.


What makes all of this particularly crazy is that there has never been a better time than now to be renting. The below graph compares the changes in MRI, a DHS index of average rents in Melbourne to the RPI, an index managed by the ABS that charts changes in residential property prices in Melbourne. Over this period, average house prices have increased by 5.64% per year while average rental cost has only increased by 2.77%. 

To put this in more understandable terms, a house that would set you back $500,000 in 2009 now costs around $695,000, while a rental property at $250 a week back then has only increased to $295. As investors have poured into the housing market fuelled by record low interest rates, they have been forced to offer their properties to renters at lower and lower fractions of the amount they spent on the property.

However, instead of happily taking advantage of this disparity we seem more desperate than ever to enter the housing market. While there are no doubt complex psychological reasons for our fixation with owning houses, I think there are also some basic economic misunderstandings that fuel this obsession as well. Below I have outlined two main misconceptions and my own efforts to debunk them.

Rent money is dead money
This is one of the most common arguments against renting. Renting, the argument goes, is simply an expense, whereas mortgage payments contribute towards owning a house. I know of some people who believe this so feverently that they kept living with their parents until they had saved enough money for a deposit. While paying down a mortgage is different to simply renting a property, people who make this argument fail to understand is the sickening amount of interest the average mortgage holder pays. As an example, let’s say you took out a mortgage of $500,000 at a 4.75% interest rate for thirty years. Over this time, your monthly repayments would be $2,608
Now, a question for you. What percentage of your first year of repayments do you think was spent on interest vs paying down debt? 

The answer is rather depressing. After 12 months and $31,298 of repayments you have only reduced your mortgage by $7,715%. Just 25% of your repayments have actually gone towards reducing your debt.

Given that the average rent in Melbourne is around $15,080 a year, we can see that the average new home buyer is destined to waste more money on debt repayments than they would have spent on rent for a considerable number of years.

Safe as houses
Another argument for the benefits of buying a house is the idea that houses are a safer investment than shares.  While it is true that housing prices are generally less volatile than the stock market, people who make this argument often fail to understand the effects that leverage has on a heavily mortgaged home owner.  

To explain this, let’s imagine a 2007 style financial crisis was to hit Australia, and the effects that would have on both someone who had recently purchased a house and someone who had the equivalent of a deposit in shares. We will make our imaginary house 500,000 and our imaginary deposit 10%, or 50,000.

The investor.
The GFC wiped just over 55% off the S&P in around 18 months, meaning if a financial crisis of identical scope was to hit Australia our share market investor would have lost $27,500, leaving them with only $22,500 of their original investment.

The home buyer.
From our home buyers’ perspective, the GFC wiped off just over 30% of American house prices on average over a longer period of around four years. If we apply that to our $500,000 Australian property this would now only be worth $350,000. Not only would the homebuyer have lost their entire deposit, they would now have a mortgage on a property that was $100,000 higher than the underlying property was worth.

This is a perfect example of the effect of leverage; what was a 30% loss in the underlying asset has resulted in a 150% loss in the investor’s capital.


I don’t know about you, but this sort of scenario scares the shit out of me. Losing some money in the sharemarket I can live with, but having a mortgage worth more than your house leaves you with no get out clause. Even if you wanted to sell you wouldn’t be able to, as you would owe the bank more than the property was worth.

Some parting thoughts…


Obviously not all decisions are purely financial. Some people hate renting, some people are desperate for a place to call their own. I’m not trying to say that buying a house with a big mortgage is always going to be a bad idea for everyone. However, if you are still convinced you want to buy a house I have one more graph for you to consider. The below shows the average mortgage rate over the last 30 years. 


Due to the RBA’s near record low cash rate, interest rates have been lower than they have been for a very long time. If you are basing all your budgets off a 6% or lower interest rate, it might be worth considering what you would do if that rate rises.

Tuesday, November 10, 2015

Blackmores and the Economics of Quackery

If you have ever turned on a commercial radio station or walked into a pharmacy the name Blackmores might be familiar. As you probably know, Blackmores sell a wide range of different vitamin supplements and health products, aimed at people wanting results with anything from pregnancy to weight loss. What you may not know, is their share price has been going through the roof lately. If you’d have been clever enough to buy $1,000 worth of Blackmore’s shares 12 months ago you’d have made yourself over $4,250 dollars as of last week.


As nice as it is to see a local Australian success story and all that, to quote Spiderman’s dad, “with great power comes great responsibility,” and once a company’s total valuation starts pushing 3 billion I feel it is time to look at them a little more closely.

Why I’m suspicious

Vitamin supplements walk a fine line between pseudo and actual science. While there is little doubt that people with specific diet problems or illnesses can benefit from certain vitamin supplements, the evidence for the use of supplements for healthy people eating a normal diet is pretty contentious, and some of the more specific products that Blackmores sell seem to have little evidence at all. Blackmores dance around this by an elegant use of the word “may” in a number of their advertisements as in the below statement regarding a folate product:

“may reduce the risk of birth defects of the brain and/or spinal cord.”

Or the below in regards to a Magnesium product they sell.

Magnesium may help to:
·         Relieve muscle cramps and spasms
What makes all of this questionable is that Blackmores sells its products at chemists and pharmacies, alongside drugs that require a much higher standard of evidence before they can be sold to the public. What’s more, Blackmores offers free courses to pharmacists and GPs on the benefits of vitamin supplements. These courses have somehow been accredited, meaning GPs and pharmacists get recognition towards their required professional development if they complete a course on the benefits of supplements paid for by a company that specializes in selling the exact same products. Can anyone else smell a conflict?
 Of course, Blackmores would undoubtedly claim that they take health and wellness just as seriously as pharmaceutical companies and have just as much right as anyone for their products to be sold in a pharmacy. While I’m ill-equipped to examine this claim from a medical standpoint, I can look at it from a financial one. What can we learn about the legitimacy of Blackmores as a serious health company by comparing them to companies in the more traditional pharmaceutical space?

The comparison
I have compared Blackmores with two well-known pharmaceutical companies, Johnson & Johnson and Glaxo Smith Kline. Both Glaxo Smith Kline and Johnson & Johnson get a large portion of their revenue from selling generic, non-prescription drugs to pharmacies at prices similar to Blackmore’s products. Panadol comes from Glaxo Smith Kline while Nicorette is a Johnson & Johnson product.

1.       Gross Margin
Gross margin is calculated by dividing the direct costs that go into making a product by total revenue. It’s a good measure of the underlying profitability of a company. One of the most well-known characteristics of the pharmaceutical industry is its high margins, so this is a good place start our comparison. The below graph compares the profit margins of GlaxoSmithKline, Johnson & Johnson and Blackmores.


2.       Advertising and marketing
Unlike Johnson & Johnson and Glaxo Smith Kline, Blackmores do not list their total advertising cost in their financial statements so we will have to do some digging for this comparison.
On Blackmores’ 2015 Profit and Loss statement Blackmores shows a charge of just under 35 million dollars for “selling and marketing” costs. No further breakdown is provided on these figures. This cost would cover both their advertising and celebrity endorsements (Blackmores has endorsement deals with both Michelle Bridges and Li Na,) and the cost of their sales staff. As a company that sells products wholesale or through their website Blackmores would not need to maintain a significant sales force, so let’s be overly generous and say that 10million of this 35 million is for sales, with the remaining $25 million going to advertising.
In addition to the “selling and marketing” expense, Blackmores lists a “promotional and other rebates” expense for just over $83 million dollars. Again, Blackmores give no additional context to this charge anywhere else in the document, so we will have to use some logic to work out what this charge is for. A rebate is a partial refund given to a customer. The ATO is pretty strict about how a company recognizes rebates, as they do not want companies to be able to manipulate their revenue by artificially increasing their sales costs and using rebates to cover the difference. For a company to list a rebate on their profit and loss as opposed to just discounting their revenue by the same amount the ATO say it must:

“directly relate to readily identifiable marketing and promotional services that are designed to secure a benefit to the supplier”

Based on this, we can infer that this $83 million is direct payment made to Blackmores wholesale customers for them to advertise Blackmore’s products to the public. Among other things, this would cover the payment Blackmores must make to Chemist Warehouse for those countless ads for Blackmores products.
When you add the $83 million dollars in promotional rebates to the $25 million dollars in direct advertising you get a grand total of $108 million spent on advertising, or 23% of Blackmore’s total revenue. Let’s compare this to the advertising spends of Johnson & Johnson and Glaxo Smith Kline.


3.       Research and development.
High Research & Development costs are probably one of the most defining features of the pharmaceutical industry. The process of developing a single drug for market was estimated by Forbes to cost at least $4 billion dollars in 2012. As Glaxo Smith Kline and Johnson & Johnson both focus mainly on generic drugs, we can expect their research & development costs to be lower than the industry average.The below graph compares our three companies in their percentage of Research & Development spend.


Again, the difference is stark. Blackmores, a company that brought in nearly 500 million dollars in revenue last year spent a paltry 9 million dollars on Research & Development.  When you consider that Blackmores released 170 new products and range extensions last year, we can estimate that Blackmores is only spending on average $52,000 on researching each product before release, or 0.0013% of Forbes’ estimated average development cost. While I think it is reasonable to expect a vitamin and supplement to spend a lower amount of money on Research & Development, a difference this large is hard to justify.

Conclusions

The above comparisons do not paint a flattering picture of Blackmores. It takes in a similar profit margin to our two pharmaceutical companies, yet its Research and Development expense is less than a fifth of both companies. Instead of spending money or researching the efficacy of its products, Blackmores has chosen to plough money into advertising and marketing campaigns. Even if you are a passionate believer in the benefits of vitamin supplements, it is hard to argue that a strategy like this is conducive for maximising the health outcomes of their customers. While Blackmore’s corporate strategy seem to be working wonders for its shareholders, it seems its customers aren’t getting as good a deal.

Sunday, November 1, 2015

There’s this unpleasant feeling I often get just after buying something expensive.  Usually it’s right as I’m walking out of the store, some big box tucked under my arm and this thought suddenly crosses my mind; How much of the money I just spent actually went into making this thing?” I’ve just decided to spend more money on some well-known brand because I thought I was going to get better quality, but is that actually the case? Or did I just spend half a weeks pay financing executive bonuses and fancy advertising campaigns?
The thing is it's a question that is actually relatively easy to answer. Most of the brands we consume are owned by publicly listed companies, which means all their financials can simply be downloaded from their website.
So that's what I've been doing for the past week or so; downloading financial reports and breaking down where the revenue goes. I have chosen five different brands that consumers pay a premium for.

1. Coca Cola
What better place to start than Coca Cola? One of the best symbols of American consumerism, inspiration for my favorite Andy Warhol quote and Warren Buffet’s stock of choice. Coca Cola make four of the five most consumed non alcoholic drinks in the world, coke, diet coke, Fanta and sprite.
Interestingly, in most countries if you buy a can of coke it probably wasn’t made by Coca Cola. Instead, Coca Cola will have sold their “syrup or concentrate” to another company who has mixed it with sparkling water, put it in a can, and sold it to the supermarket where you brought it. In Australia’s case that company is Coca Cola Amatil, which is part owned by Coca Cola, but in other countries some of these bottling companies are completely independently owned.

By combining the graphs of Coca Cola Amatil and Coca Cola I came up with the below graph. I have based this off 90 cents as this is my best estimate of what coke get when you buy one of their cans.


As you can see, only roughly 26 cents of the money coca cola get goes into making the actual can and contents, whatever those secret ingredients are they definitely aren’t expensive.
a 28% profit margin is pretty impressive, especially when you consider that what they are making is basically fizzy sweet water. I guess Warren Buffet knows what he is talking about after all.

2. Prada
Prada has been listed on the Hong Kong stock exchange since 2011 and the majority of their goods are sold directly to customers through Prada owned stores. Like Coca Cola, the vast majority of Prada's products aren’t actually made by Prada themselves, instead the prototype will be made by Prada who then ship it to one of their suppliers who mass produce it.

Let’s take this Prada handbag for an example which retails for an eye watering $2,450 AUD.


Once you take the GST out, you're left with the below graph.


That’s right, less than a quarter of the money spent on a Prada handbag actually goes into making the bag, not really great value for money when you think about it. The biggest cost by far is for their retail stores, which Prada invests considerably in. 4% on design seems a little excessive, especially considering as far as I can tell all their bags look the same, but then again I'm not really known for having much fashion taste so what would I know?

3. Apple
Just like every other company listed before, Apple don’t actually make their iPhone’s, they are manufactured for them by various companies. The new Iphone went on sale in Australia for $929. Once you take out GST, you are left with the below graph.


It’s pretty hard not to be impressed with this breakdown. Apple spend the highest portion so far out of any company on producing the product, yet still are left with the equal highest profit margins. Furthermore, despite being one of the most recognized and respected brands in the world, their advertising spend is only 1% of total revenue.
I should point out that Apple only sell a small portion of their phones through their retail channel so you could argue that the selling and admin costs (which is where the cost of the stores is recorded) are artificially low.

4. BMW.
At last, a company that actually makes the product it sells! BMW take complete control of the entire production process, then (like all other car manufacturers) outsource the actual selling of their vehicles to independent dealers.
The below graph breaks down the costs of BMW 3 series in Australia. I have used the manufacturer’s list price as a starting point, which excludes GST, on road costs and dealer delivery (which is where most of the dealers margin is.)


A lot has been said about how unprofitable the car industry is but it still seems strange that BMW, manufacturer of some of the most innovative and market leading products in the world takes in an average profit margin that is lower than Coca Cola.
Interestingly, the research and development expense is more than twice as high as Apples, though I think that says more about Apples transition from an innovative start up to a corporate machine than anything else. All in all, based on this data the value for money you get from buying a BMW seems pretty good. 73% of the money that BMW gets from a vehicle goes towards either making the product, developing it, or providing warranties.

5. Nike.
Once again, we are back to a design a prototype, get it mass manufactured in the third world, then ship it to the stores model.

Nike is one of the most iconic brands around and famous for its massive advertising and endorsements spending. According to some website, there was a year in which Michael Jordan was paid more than the entire Indonesian workforce that actually made the shoes, though I haven’t been able to find a reliable source for that.

The below graph breaks down the EX GST cost of a pair of Le Bron XII’s.


Unsurprisingly, Nike have the highest spend on advertising of the lot, at 11% of their total revenue. All research and development costs are included in their cost of sales which means I have been unable to give a separate breakdown for this.


I hope you have found this interesting. For me, the biggest surprise I got from this was discovering how standard it is for companies to outsource the actual manufacturing of their products. It's hard not to conclude that companies mainly do this so they don't have to take responsibility for the working conditions of third world factories, which makes the whole practice seem pretty grubby. Lastly, as consumers we don't often take into account profit margin or advertising spend when deciding what brands to buy, but maybe that is something we should start thinking about more.

For the finance nerds out there, I have used EBIT as a measure of profit as I think the company structure and tax rate should be irrelevant in this sort of analysis. For all graphs I have used the unadjusted figures from the financial reports except for Coca Cola's, where I have had to combine the reports from Coca Cola Amatil and Coca Cola.